
The Best And Worst Shooters Of Today And Yesteryear
Exploring changes in shot selection and accuracy from the 2001-2002 to 2020-2021 seasons
As we discussed in a previous post, the number of threes shot by the league has been climbing steadily. I wanted to dive a little deeper into how shot distribution has changed since twenty years ago.
Below is a chart showcasing the ten players in the NBA with the highest field goal attempts (FGA) at different distances from the basket. Each bubble represents a different player, and the size of the bubble correlates to the number of FGA per game by that player. To avoid overcrowding the data, I’ve only labeled the best and worst shooter at each distance within that cohort (sorry to put the spotlight on you, Andre Drummond). Still, it shows some interesting quirks about modern NBA offenses.
2020-2021 Season
I want to emphasize that these aren’t necessarily the best or worst shooters overall. For example, Tony Snell led the league in three-point percentage at a whopping 56.9%, but on such low volume that it’s not interesting or meaningful (he’d be a tiny, tiny circle way above Steph Curry in the 3P column). This chart highlights the ten most prolific gunners from each distance, regardless of accuracy.
With that out of the way, let’s move on to our findings. First, you can see that the biggest bubbles by far are at the three-point range and the basket (0-3 feet). This emphasizes that even the most prolific mid-range artists aren’t shooting nearly as many shots from the in-between zones as the three-point bombers or close-range finishers.
Another finding is that field goal shooting percentage (FG%) is not that much lower for threes than for any of the middle distances. This highlights why coaches and teams have emphasized taking threes instead of long twos - threes are worth 50% more, and players are only slightly less likely to make them. It’s easy to understand this in theory, but it’s illuminating to see it laid out so cleanly in the data.
Finally, I was a little startled to see how closely clustered the three-point bubbles are. Turns out all of the players who shoot lots of three are pretty good at them! Shots at the rim have a wider spread. Andre Drummond somehow shot below 60% on what amounts to only close layups and dunks (Giannis shot over 80% from the same spots!).
Finally, let’s give a shout-out to Steph. He shot over 12 attempts per game from three (more than Zion’s 11 rim attempts), the most in the league of any one person from any distance, and ALSO made an astonishing 42% of them. Generally speaking, increased volume usually leads to decreased efficiency, but common knowledge holds no sway in the courts of generational talents.
So how does the bubble chart above compare to, say, 20 years ago? Glad you asked!
2001-2002 Season

Wow! There are some significant differences. Firstly, the mid-range was clearly alive and well, and there were a considerable number of shots taken by the big gunners in the 16-3P range. There was a much more even distribution of shot attempts across ranges, as players shot from all areas of the floor at whim.
You can see that some of the broader trends still hold true. The three-pointer was still almost as accurate as any shot past the 0-3 foot range and yet the volume was significantly lower than the 16-3P range. However, there was much more clustering in the 16-3P range compared to 3P compared to what we saw in 2020-2021.
It shows the evolution of what players focus on in practice. As they pushed their range further and further back over the years, everyone got pretty good at taking threes. Players twenty years ago still practiced deep mid-ranges often and spent less time practicing threes outside of a handful of sharpshooting specialists.
Now, let’s look at these charts side-by-side for easier comparison.
2001-2002 vs. 2020-2021
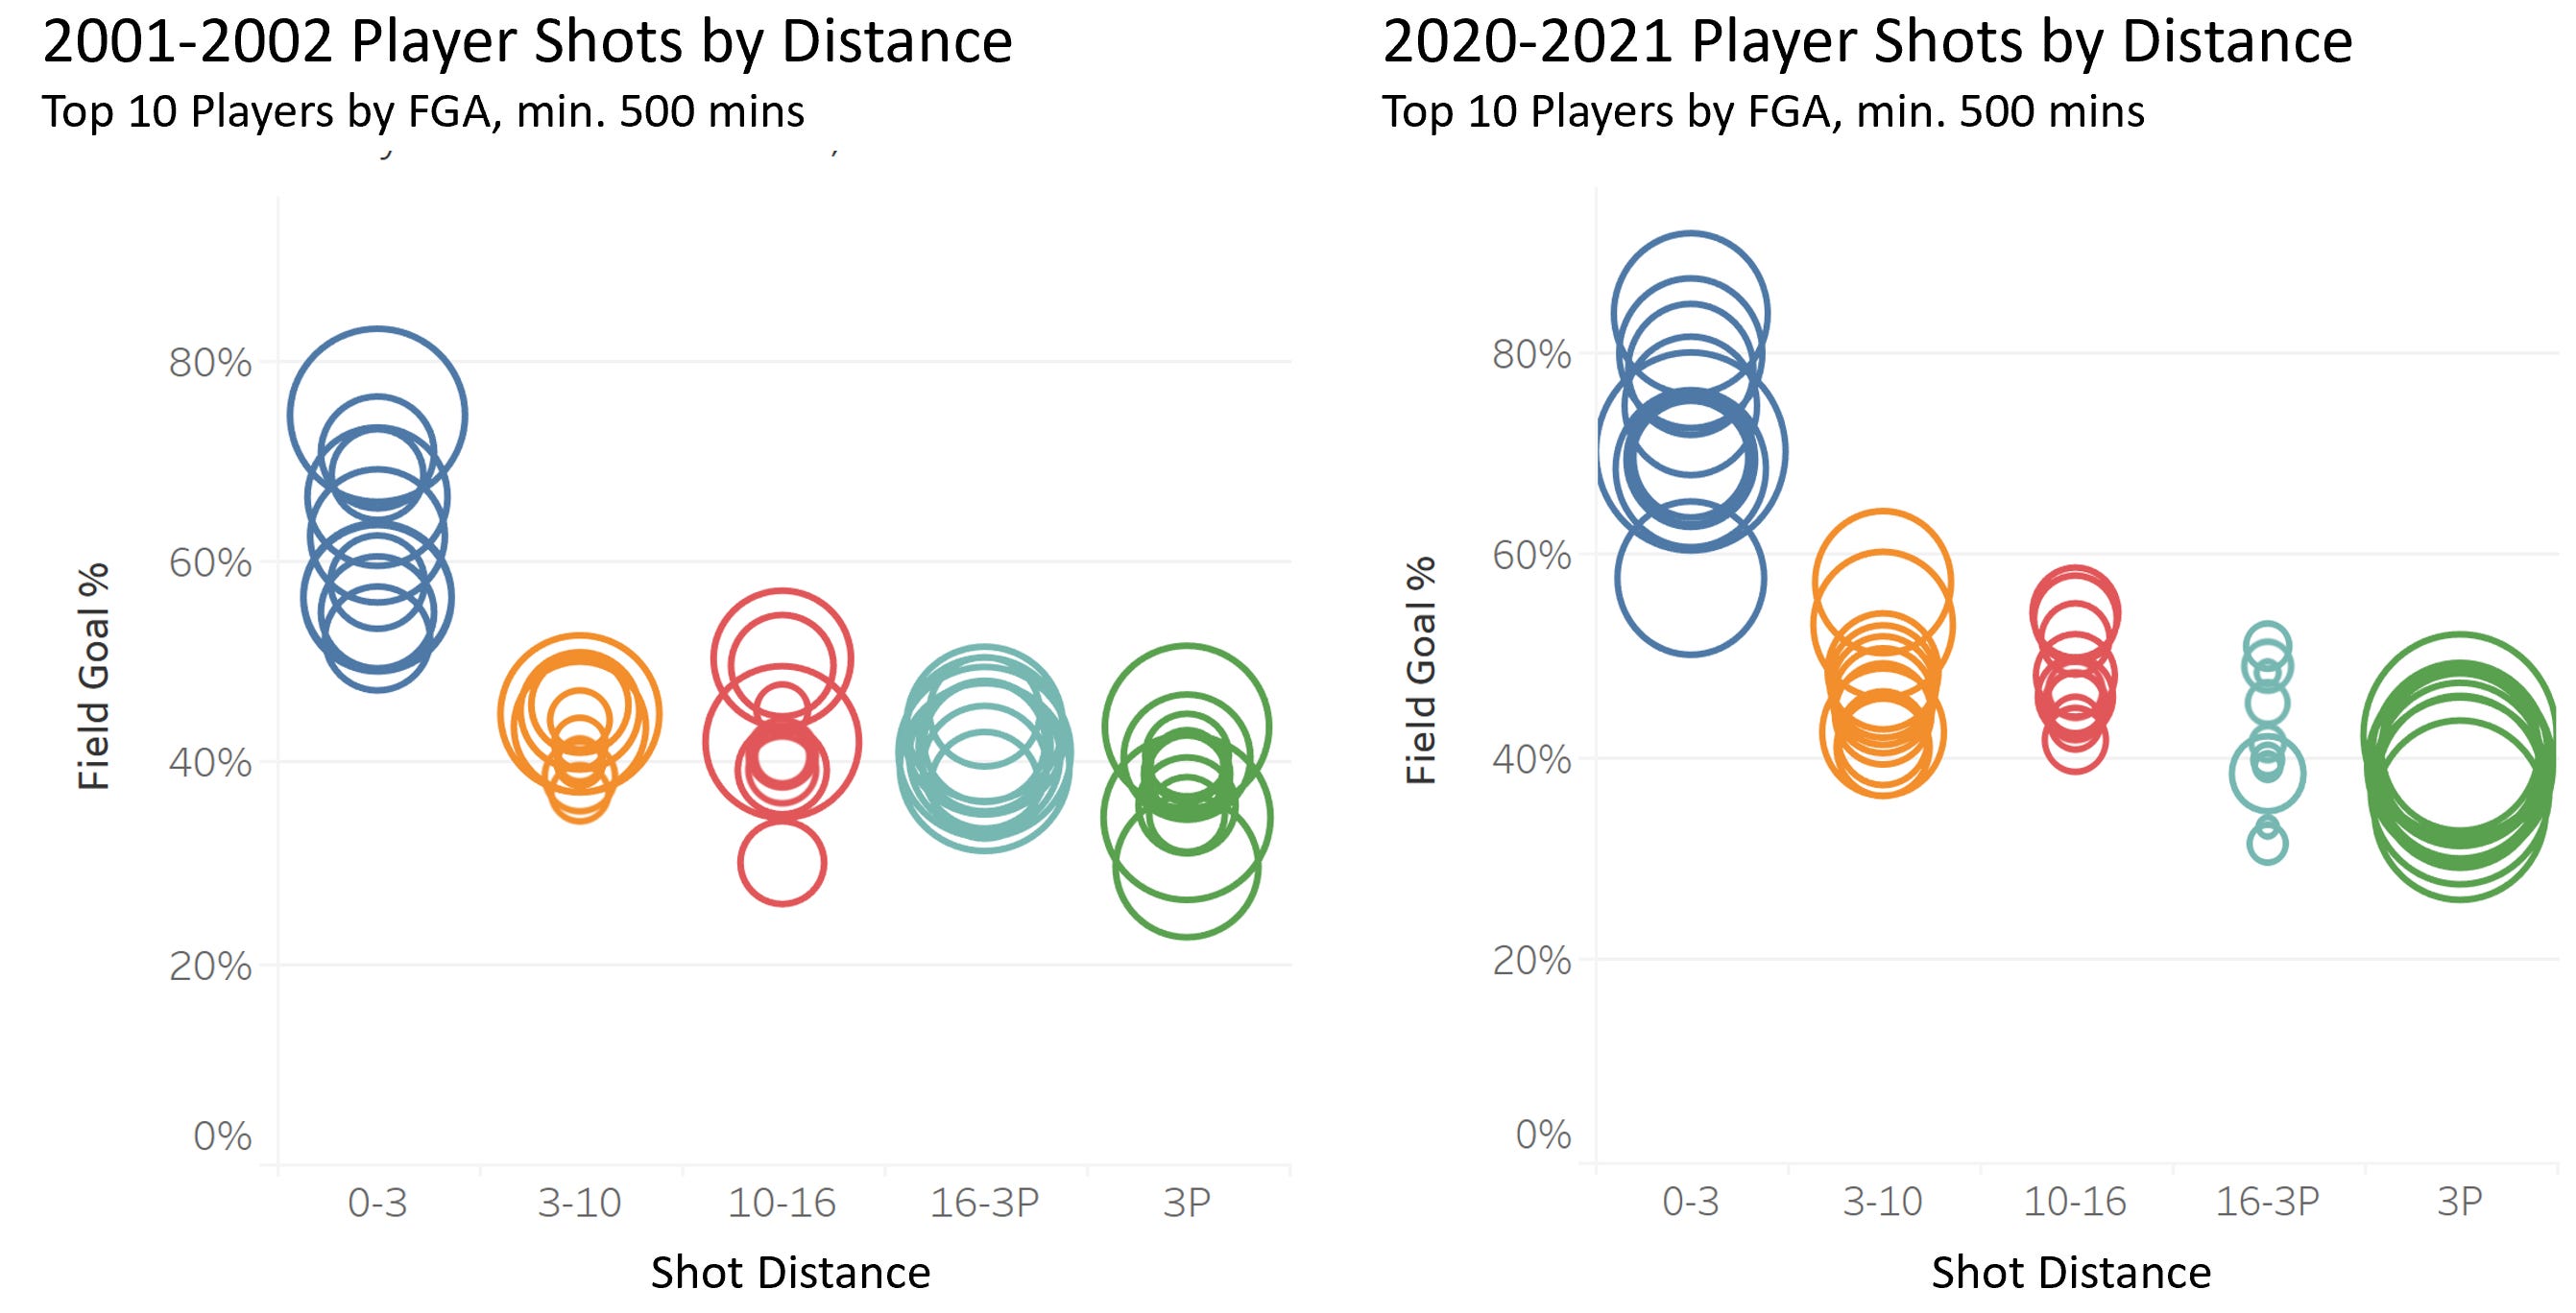
We can immediately see the shot selection disparity by the size of the bubbles. Much bigger bubbles today at 0-3 and 3P and much smaller at 10-16 and 16-3P, no surprises there.
One thing that sticks out, besides mid-range volume disparity, is how much better people are at shooting today than they were back then. The average FG% of the top shooters at each position is clearly higher for 0-3, 3-10, and 10-16 and slightly higher for 16-3P and 3P than twenty years ago. Shooters are more skilled than ever as they become more selective with their shot locations.
There are a lot of cool insights to be gleaned from shot distance data, and I intend to explore those further in future posts. So if you didn’t like this blog because it was too in-the-weeds and confusing, please let me know in the comments! Likewise, if this is the analytical content you crave, do the same thing! As usual, please like, share, comment, etc. etc. etc.
Until next time, enjoy basketball.